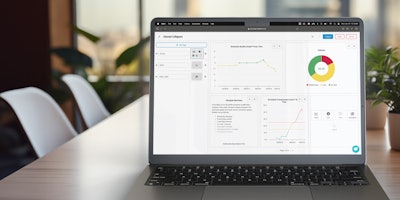
SmartPM Technologies has released a Custom Reporting feature, allowing users to visualize their schedule data. The solution serves to help companies transmit information about project status.
Allowing users to design reports that present visual project data supports information accessibility for individuals. SmartPM’s drag-and-drop functionality enables users to create a report that “tells a story” rather than just presenting data.
“With this release, we wanted to give our customers the ability to home in on the risks that exist in their projects based on what is most important to them. This will help communicate critical information for project controls because users can dig into the data, highlight relevant risk, and succinctly communicate across the board,” said Rohit Sinha, CTO of SmartPM Technologies.
With the data they need delivered to their inbox, customers are reducing the amount of time spent preparing reports for stakeholder review. “With the custom reporting feature, every time a schedule is synced, everyone – me, the senior project managers, the entire team – can get the same report with the data most important to us and go from there,” said Taylor Shapland, project executive at NGC Group, Inc.
SmartPM CEO and founder Michael Pink added, “Automating this process fills a significant gap in the project controls industry, marking a major leap forward for our customers.”
When asked about the rationale for developing the custom reporting feature, SmartPM co-founder Billy Upchurch said, “The only way to become data-centric is for everyone to have access to the same data at the same frequency, in a format that is easy for everyone to understand. More importantly, with this update, we’re making SmartPM a more effective tool. It’s not just about the data, it’s how it gets presented. In that respect, we’ve taken a huge step forward, and our customers will be the beneficiaries.”


